
- ✓Income taxCalifornia’s largest General Fund source — the biggest single stream feeding that 40% guarantee.
- ✓Sales & use taxSame pot. Same 40% guarantee.
- ✓Corporation & insurance taxSame pot. Same 40% guarantee.
- ✓Property taxCounted first — $71.7M of local revenue is credited inside Burbank’s formula before Sacramento adds a dollar of state aid.
- ✓LotteryMore than $1.9 billion to California education in 2024–25.
- ✓Federal taxesTitle I, special education and school nutrition reach the district separately.
- ✓2013 Measure S$110 million, still being repaid on your property-tax bill.
- ✓2024 Measure ABC$458.2 million — about $40.69 per $100,000 of assessed value, every year.
Let us be plain. The Burbank Republican Party opposes California’s school-funding allocation system and every attempt to make local taxpayers repair it with another bond or parcel tax. Burbank households and businesses already contribute through income, sales, corporation, insurance and property taxes, federal taxes, existing school-bond levies and other charges. A new local tax does not reform the formula. It simply adds another bill.
Precision matters. Proposition 98 establishes California’s minimum funding guarantee for K–14 education. The Local Control Funding Formula determines most district allocations. Burbank receives LCFF base and supplemental funding, but at a 38.4% unduplicated-pupil rate it remains below the 55% threshold for concentration funding. That is the policy we want Sacramento to reform.
Current expense per ADA
2024-25 general-fund operating measure
Rank in this comparison
same CDE current-expense measure
Local revenue inside LCFF
credited within BUSD’s formula sources
Burbank unduplicated pupils
below the 55% concentration threshold
The formula bridge Burbank taxpayers should see first
BUSD 2025–26 Adopted Budget. These are revenue sources, not four additional bills to be added together.
| LCFF source | Amount | What it means |
|---|---|---|
| Total LCFF sources | $170.1M | The district’s full LCFF funding-source total. |
| Local property taxes and other local revenue | $71.7M | Local revenue credited within the LCFF source calculation. |
| Education Protection Account | $27.1M | A separately identified state component within LCFF. |
| Net state formula aid | $71.3M | The remaining state component reported in the adopted budget. |
This table shows the actual accounting bridge. It does not claim that an individually traceable Burbank tax dollar was transferred to a particular district.
Start with the simple picture
Before the formulas and the acronyms, one plain fact: Burbank residents and businesses already contribute through multiple state, federal and local revenue streams. The district’s own adopted budget shows where school money appears — and where bonds, parcel taxes, construction fees and unrelated state charges do not.
The fuller tax-and-revenue map: what feeds school aid, what reaches schools separately, and what does not
This is the distinction the short version missed. California’s school system is financed through a layered public-revenue structure, not just three household taxes.
Personal income tax
The largest state General Fund source, including revenue affected by capital gains. Proposition 98 ties school funding partly to General Fund revenue.
General Fund → Proposition 98 → school aidRetail sales and use tax
A major General Fund source paid on taxable purchases. Sales and use tax on a taxable vehicle purchase belongs here; it is different from annual DMV registration charges.
General Fund → Proposition 98 → school aidCorporation tax
California corporations pay this major General Fund tax. It is not a household line-item, but it helps fill the same statewide fund from which school aid is appropriated.
General Fund → Proposition 98 → school aidInsurance gross-premiums tax
Insurers pay tax on California premiums into the General Fund. Consumers pay premiums, but the legal taxpayer is the insurer; it should be counted accurately, not mislabeled as a separate household school tax.
General Fund → state obligations, including educationOther General Fund receipts
Alcoholic-beverage excise tax, the General Fund share of cigarette tax, investment income and other state receipts also appear in the state’s General Fund ledger. They are smaller than the four sources above, but they are not zero.
General Fund → statewide budgetThe 1% base property-tax levy
The county allocates a share to Burbank Unified. Sacramento counts that local amount toward the district’s LCFF entitlement before calculating state aid.
Local collection → BUSD → credited inside LCFFCalifornia Lottery proceeds
This is voluntary gaming revenue, not a tax. The Lottery reports more than $1.9 billion for education statewide in 2024–25; it is supplemental and allocated to K–12 districts based on average daily attendance.
Lottery sales → dedicated supplemental education fundingFederal tax-supported programs
Federal revenue reaches districts through programs such as Title I, special education, school nutrition and other grants. BUSD budgets this separately from state and local sources.
Federal Treasury → restricted grants → BUSDOther state and local school receipts
Categorical state programs, the Education Protection Account, rents and leases, interest, donations and other district receipts sit outside the basic LCFF property-tax-and-state-aid calculation.
Dedicated or local sources → BUSDBonds, parcel taxes and developer fees
These are extra local layers. Bonds are debt repaid through added property-tax levies; parcel taxes are separate local taxes; developer fees are restricted facilities charges.
Additional local charge → specified local purposeDMV fees are real bills — but most are not school revenue
Annual vehicle registration commonly includes a registration fee, a California Highway Patrol fee, a vehicle license fee, a Transportation Improvement Fee and county or district charges. The DMV says the Transportation Improvement Fee pays for roads, bridges and maintenance, while the 0.65% vehicle license fee funds cities and counties. These charges add to the household burden, but putting them into BUSD’s school-funding total would be false.
The honest argument is stronger: show every tax and fee residents pay, identify which streams actually finance education, and stop pretending that a new parcel tax or bond is the first or only public bill.
Burbank Unified’s $213.4 million operating-revenue picture, itemized
2025–26 Adopted Budget. The two yellow slices are locally generated revenue; the blue slices are state-controlled funding. Percentages may not total exactly 100% because of rounding.
Already collected locally and counted by the state toward Burbank’s formula target$71.7M
33.6%
Separate district receipts outside LCFF$4.1M
1.9%
State formula aid after the local property-tax credit$71.3M
33.4%
State funding within LCFF$27.1M
12.7%
Programs outside LCFF$31.2M
14.6%
3.7%
Then come the extra local charges layered on top
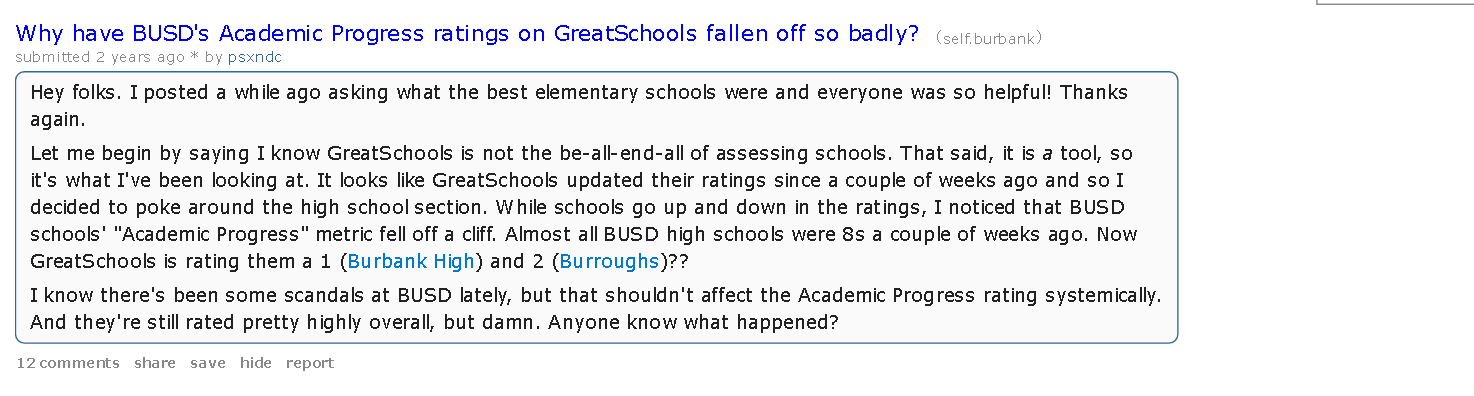
These items are shown separately because they are not interchangeable with the $213.4 million operating-revenue pie. Bond proceeds and developer fees are restricted to facilities; the two prior parcel-tax proposals failed and produced no current revenue.
2013 Measure S bond
$110 million principal, repaid with interest through an added levy on property-tax bills.
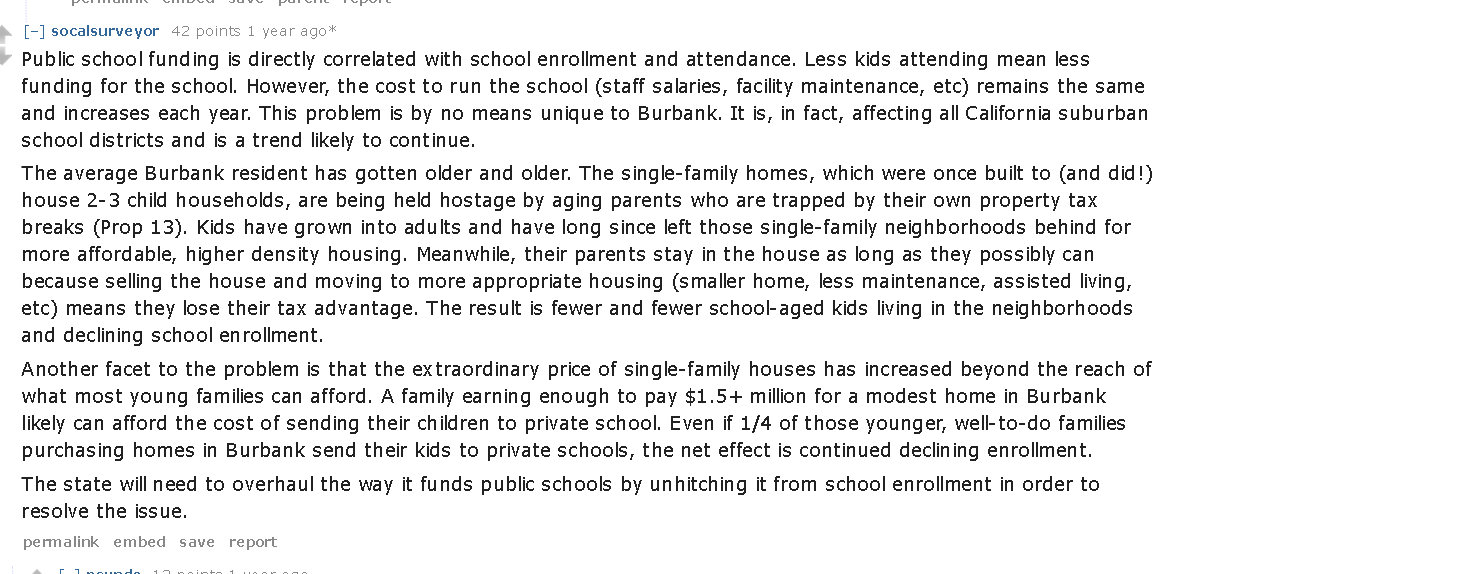
Passed · Property-tax bill2024 Measure ABC bond
$458.2 million principal, estimated at $40.69 per $100,000 of assessed value each year.
Passed · Property-tax bill2018 QS + 2020 I parcel taxes
Each sought about $9 million a year. Both fell short of the required two-thirds vote.
Defeated · $0 current revenue2025 construction impact fees
State-authorized facilities charges on new residential and commercial construction, plus the district’s added local growth fee.
Capital facilities onlyAlso proposed: another parcel-tax attempt for salaries and programs. Until voters approve one, it is a proposal — not part of current revenue.
That is the fair-share point, item by item. State school aid is supported by a General Fund filled principally by personal income, sales and use, corporation and insurance taxes, alongside smaller receipts. Burbank already supplies the local property-tax share counted inside LCFF. Lottery proceeds, federal programs and categorical state grants add separate streams. Homeowners and renters then carry voter-approved school-bond levies, while builders and ultimately buyers or tenants absorb facilities fees. The argument is not that every tax or fee becomes a classroom dollar; it is that Burbank households and businesses contribute through a wide tax-and-revenue stack before any new local measure is proposed.
Our position is not ambiguous
Vote no on every new school parcel tax — and every new school bond.
What it is: A parcel tax is a new bill. It does not return the taxes Burbank already paid.How it should have been handled: Fight Sacramento for Burbank’s fair share and balance existing priorities before charging residents again.
What it is: A bond is a loan. Property owners repay principal plus interest for years or decades.How it should have been handled: Forecast capital needs and save toward them every year in a dedicated reserve.
What it is: Roofs, HVAC, plumbing and electrical systems wear out on predictable schedules.How it should have been handled: Inspect every asset, record its remaining life and schedule replacement before it fails.
What it is: Deferred maintenance is work postponed from an earlier budget.How it should have been handled: Fund the scheduled work in each annual budget and report publicly whether the reserve remains on target.
What it is: A last-minute crisis is being used to justify new debt.How it should have been handled: Publish the lifecycle schedule, annual savings, alternatives and full principal-and-interest cost before asking voters for anything.
What it is: Enrollment is shrinking while the district continues carrying the same large facility footprint.How it should have been handled: Publish a campus-capacity and consolidation analysis, cut avoidable carrying costs and professionally market safe unused time and space before asking taxpayers for more.
What it is: Outside permits supply 9.2% of enrollment while BUSD-resident enrollment fell by 434 students in one year.How it should have been handled: Put resident access first, publish the true net fiscal result of every permit cohort and never use imported headcount to avoid asking why local families left or to postpone right-sizing.
No more blank checks: no new parcel taxes and no new school bonds.
It was not always so — how we lost control of our own money
Once, a community funded its own
For most of California’s history, a town’s schools were paid for by that town’s own property taxes, set by its own elected board. A community that valued its children could invest in them directly — and did. Your money stayed home, and worked here.
1971–1977 — the courts order “equalization”
In Serrano v. Priest, the California Supreme Court judged the gaps between districts too wide — Beverly Hills spent $1,232 a pupil while Baldwin Park spent $577 — and ordered the state to equalize. From then on, Sacramento would cap what an investing community could keep, and spread the rest around.
1978 — Proposition 13 hands the keys to Sacramento
Prop 13 capped the property tax at 1% — and, fatefully, handed the power to divide up that property tax to the state. From that day forward, the local dollar had to travel up to the capital before it could ever come home.
1988 — Proposition 98 creates a statewide minimum
Proposition 98 established a constitutional minimum funding guarantee for K–14 education using state General Fund and local property-tax revenue. It created the size of the protected statewide funding pool; it did not create today’s district-allocation formula.
2013 — LCFF changes how the statewide pool is allocated
Every district receives base funding. Supplemental funding rises with the share of unduplicated pupils, while concentration funding applies only to the portion above a 55% threshold. Burbank receives supplemental funding but remains below that concentration threshold.
Read the arc plainly. Property-tax allocation became centralized, Proposition 98 established the statewide minimum, and LCFF later determined how most of that protected pool is distributed among districts. The argument here is not that Burbank receives nothing; it is that the current allocation rules leave Burbank below the concentration threshold and local officials repeatedly answer that pressure with another local tax proposal.
Fact check: Prop 98 is the floor; LCFF is the Robin Hood formula
Precision matters because Sacramento should not be allowed to hide behind a jumble of ballot numbers and acronyms. Proposition 98 did not itself create the equalization formula. The court-ordered equalization movement began with Serrano; Proposition 13 centralized control over the allocation of the base property tax; and Proposition 98 later guaranteed a minimum statewide funding level for K–14 education. The modern “Robin Hood” mechanism is the Local Control Funding Formula: every district receives a base amount, while supplemental and concentration grants steer more of the statewide pot to districts with larger shares of high-need students.
The effect on Burbank is the injustice at the center of this report. Our property-tax contribution is counted first, state aid fills only the formula balance, and targeted dollars are then weighted toward other districts. Burbank families have already paid our fair share through income tax, sales and use tax, and property tax; LCFF determines how much of the statewide pool comes home. A new parcel tax does not fix that formula. It merely charges Burbank again.
The Sacramento overhead drag — itemized, not exaggerated
The bureaucracy handling California education money is real and expensive. The enacted 2025–26 state budget authorizes the California Department of Education to spend $509.5 million on state operations across all funds. That includes 2,683 positions, $358.6 million in personnel costs, $146.5 million in operating expenses and equipment, and $4.4 million in special items. The State Board of Education alone accounts for $5.4 million and 24.1 positions within that structure.
The state layer that sits above local school districts
California Department of Education, enacted 2025–26 budget. Dollars in the first three boxes are included in the $509.5 million state-operations total.
The honest ratio: CDE state operations equal roughly 45 cents for every $100 of local assistance shown in the department budget. That is a meaningful taxpayer-funded layer, but it is not a 45-cent fee physically clipped from each $100 of Burbank’s LCFF check. CDE operations use multiple funding sources and include functions such as federal-program administration and state special schools.
The less visible drag is compliance. A recent statewide governance analysis describes overlapping authority among the CDE, State Board, Commission on Teacher Credentialing, county offices and other bodies; it also calls California’s Education Code exceptionally long, complex and fragmented, requiring districts to produce numerous reports. That consumes state payroll, district staff time, consultants, audits, data systems and meetings before a teacher ever sees the benefit.
What cannot honestly be claimed: no official source publishes a Burbank-specific dollar amount for all state-mandated compliance labor, and the state-operations budget is not a direct percentage deduction from the district’s apportionment. We will not invent a number. We will demand that the people asking for another tax publish it.
Open the books · Read every line
Before another tax, examine the complete payroll and management structure.
The district’s fiscal-year 2025–26 file lists 2,573 employee records, $132.3 million in gross pay and another $53.6 million in employer-paid benefits — $185.9 million in total employer compensation. The file includes the dedicated teachers and school employees we support, and these totals do not establish that any particular employee is overpaid or underpaid. They do establish the scale of the public payroll and why voters deserve to inspect management compensation and the full cost structure before being asked for another tax.
Does the benefits number include retirement? Yes, the employer-benefit category used in California school accounting includes employer CalSTRS and CalPERS retirement contributions. It also includes health and welfare coverage, Social Security/Medicare or an alternative retirement plan, unemployment insurance, workers’ compensation, OPEB and certain other benefits. The spreadsheet does not separate those pieces, so it cannot tell us the pension-only amount.
Now look at the top of the payroll. These are the five highest records by total employer compensation, in descending order, ranging from $264,201 to $344,516 for the year:
| Name | Reported position | Gross pay | Benefits | Total employer compensation |
|---|---|---|---|---|
| Oscar Macias | Interim Superintendent | $278,678.22 | $65,837.52 | $344,515.74 |
| Peter J. Knapik | Assistant Superintendent of Educational Services | $229,312.92 | $65,526.72 | $294,839.64 |
| Jennifer Ann Nicholson | Director of Special Education | $207,198.45 | $65,821.18 | $273,019.63 |
| Sarah Jean Rudchenko | Paid Leave — Certificated | $210,625.17 | $55,389.88 | $266,015.05 |
| Kenneth D. Knoop | Senior High School Principal | $191,213.04 | $72,987.67 | $264,200.71 |
Those records do not prove that compensation caused a particular repair to be deferred. They do establish the scale of the highest-paid records in a system asking residents to assume more debt. Before that happens, taxpayers are entitled to see where the annual maintenance savings went, which repairs were deferred, and why disciplined saving was not enough.
The large button opens the full 69-page payroll in this page’s document reader. The Excel button downloads the original workbook unchanged. Source stated in the workbook: Los Angeles County Office of Education payroll reporting, July 1, 2025–June 30, 2026.
LCFF leaves Burbank below the concentration threshold
Proposition 98 protects a statewide minimum. LCFF decides how most of that protected funding is allocated. At a 38.4% unduplicated-pupil rate, Burbank receives base and supplemental funding but no concentration funding, which applies only to the portion above 55%. That is a real policy choice — and it is the choice Sacramento can change without weakening the statewide school-funding floor.
The objection is not that struggling children elsewhere should receive nothing. It is that the formula should not create a sharp divide and then leave local officials to answer every budget pressure with another bond or parcel-tax proposal.
- Keep the statewide minimum. Every California child deserves a properly funded school.
- End the concentration cliff. A student does not become suddenly cheaper because a district is just below the 55% threshold.
- Stop the second bill. Sacramento should reform the formula before local officials ask already-taxed households for another bond or parcel tax.
Current general-fund expense per ADA: Burbank is No. 35 of 39 Los Angeles County districts
2024–25 CDE Current Expense of Education per average daily attendance, for the 39 Los Angeles County school districts reported by the CDE via LA Almanac — Beverly Hills and Pasadena at the top, Burbank 35th, Redondo Beach last. This is a general-fund operating-expense measure, not total revenue, total spending or a direct measure of money transferred between districts.
“Inglewood reports $29,101 in current expense per ADA — 77% more than Burbank’s $16,445. Before asking Burbank voters for another tax, officials should explain this gap using the same accounting measure.”$29,101 − $16,445 = $12,656; $12,656 ÷ $16,445 = 77.0%. District costs and funding sources differ; this comparison does not trace a Burbank tax dollar to Inglewood.
BurbankOther cities
Burbank has a large city tax base — but city assessed value is not BUSD revenue.
The County Assessor reports $34.24 billion in citywide assessed value, ninth among 88 incorporated cities. That fact shows the scale of Burbank’s taxable property; it does not prove how much BUSD should receive. City and school-district boundaries differ, and the 1% levy is divided among several public agencies. The proper demand is a district-level accounting that connects BUSD’s exact tax base, local property-tax allocation, LCFF entitlement and state-aid calculation.
No more new local taxes. BUSD should publish that district-level bridge and take the documented formula problem to Sacramento before asking households and businesses for another bond or parcel-tax bill.
Accuracy note: the city assessed-value ranking and the CDE current-expense ranking measure different things. Neither one alone proves a transfer or establishes BUSD’s proper funding level.
Then comes the second bill — the local tax stack
Burbank residents already pay into the statewide system, and BUSD’s locally allocated property-tax revenue is counted inside its LCFF sources. Local bonds and parcel taxes are separate charges layered on top. They may fund local purposes, but they do not repair LCFF — and they still reach the same households, rental properties and businesses.
And it is not one tax. It is a stack, built layer on layer for more than a decade: two general-obligation bonds tied to your property, two parcel taxes the Board tried and failed to pile on top, a brand-new fee on construction, and continuing discussion of another parcel tax. Every layer lands on Burbank property. Here is the entire record in one place.
Vote no on every new school bond: “facilities only” is the legal rule — not a budgeting defense
Why bond proponents say it, and the question that slogan avoids.
California Constitution Article XIII A, section 1(b)(3) gives school facility bonds a 55% voter threshold only when the proceeds are limited to constructing, reconstructing, rehabilitating, replacing, furnishing or equipping school facilities, or acquiring or leasing real property. The Constitution expressly forbids using those proceeds for teacher and administrator salaries or other operating expenses and requires a project list and annual independent audits.
That answers what borrowed money may buy. It does not answer why the district had to borrow it. Roofs, plumbing, HVAC, electrical systems, classrooms and equipment wear out on schedules that can be forecast years in advance. A bond does not make those costs disappear; it moves them to future property-tax bills and adds interest.
| What Burbank’s adopted budget shows | 2025–26 | The question voters should ask |
|---|---|---|
| Deferred Maintenance Fund 14 | $0 revenue · $0 spending $18,860 ending balance | Where was the annual lifecycle reserve for predictable repairs? |
| Special Reserve Fund 40 for capital outlay | $3.0M spending $12.9M ending balance | How did the long-range capital plan allow needs to grow to bond scale? |
| Measure S + Measure ABC | $568.2M principal plus interest | What would annual saving, phased work and state matching funds have avoided? |
Our standard is simple: before asking taxpayers to finance decades of debt, publish the age and expected replacement date of every major asset, the annual amount reserved for replacement, the maintenance work deferred each year, every state grant pursued, and the full principal-and-interest cost of each alternative. “Facilities only” tells voters where the borrowed money is legally fenced. It does not prove the district saved, planned or budgeted responsibly before borrowing.
A capital reserve of $12.9 million cannot by itself cover hundreds of millions in claimed projects. That is precisely why the public needs a year-by-year lifecycle plan rather than a crisis sales pitch after predictable maintenance has accumulated.
Every local tax & fee the school board has put — or tried to put — on Burbank property
Bonds and developer fees are charged on your property and your construction. The parcel taxes needed a two-thirds vote — and failed, twice.
| Year | Measure / fee | What it is | What it costs you | Result |
|---|---|---|---|---|
| 2013 | Measure S | $110 million facilities bond | Added to your property-tax bill until repaid, with interest | Passed · 61.8% |
| 2018 | Measure QS | Parcel tax — 10¢ per sq ft of your building, permanent | ~$9 million a year, with no end date | Defeated · 64.3% (needed 66.7%) |
| 2020 | Measure I | Parcel tax — 10¢ per sq ft of your building, 12 years | ~$9.1 million a year | Defeated · 64.1% (needed 66.7%) |
| 2024 | Measure ABC | $458.2 million facilities bond | ~$40.69 per $100,000 of assessed value, every year — about $30.3 million a year | Passed · 63.7% |
| 2025 | Developer “growth” fee | +38¢ per sq ft on new construction, on top of the state fee of $5.38/sq ft on homes and 87¢/sq ft on commercial | ~$34 million over five years, on every new unit and major remodel | Adopted by the Board |
| 2026 | Parcel tax (planned) | A third parcel-tax attempt — this time earmarked for salaries and programs | Rate to be set — on your property, again | Being drafted for your ballot |
Rejected by voters (two-thirds required)Charged directly on your property or construction
Now look at the parcel taxes one by one — and how close each came
A parcel tax is the only layer that needs your vote: two-thirds — 66.7% — must say yes. The blue bar is the share who voted yes; the red line is the two-thirds wall it had to clear. Both real attempts died in the narrow gap between them.
Share who voted yesThe two-thirds (66.7%) wall a parcel tax must clear
Add the two authorizations and Burbank voters approved up to $568.2 million in principal — $110 million in 2013 and $458.2 million in 2024. Interest and total debt service are additional. Before another bond is proposed, voters should receive the official issuance-by-issuance repayment schedules, interest totals and final maturity dates in one plain-English table.
Assessed value is usually well below market value under Proposition 13, so use the figure on your county tax bill. This is Measure ABC alone — the 2013 Measure S levy is charged on top. Nothing you type leaves your device.
A “growth” fee for a shrinking district
Look closely at the newest layer and the whole scheme gives itself away. In April 2025 the Board raised the developer fee — the school-impact fee that state law (Education Code §17620 and Government Code §65995) lets a district levy on construction. Every new home, and every sizable remodel or ADU, now pays the state rate of $5.38 per square foot of residential space and 87¢ per square foot of commercial — plus an extra 38¢ per square foot funneled into the district’s new “growth fee fund,” a projected $34 million over five years.
A “growth” fee — for a district that is shrinking. Burbank Unified’s own Facilities Master Plan modeled total enrollment falling 12% to 20% from 2023 to 2033, depending on the birthrate scenario. The district’s assistant superintendent asked the obvious question at the Board table: “Now here’s the big elephant in the room. We’re experiencing declining enrollment. So why would we be doing this?” Fewer children alongside a new growth-related fee is a contradiction taxpayers deserve to see explained with project lists, enrollment assumptions and a public accounting of the need.
And here is the sleight of hand that binds the whole stack together. Bond money and developer fees are legally locked to buildings — by law they cannot pay a single teacher or fund a single program. So the district gathers hundreds of millions for facilities, then turns around and says the classroom is still short — and uses that shortfall to justify yet another parcel tax. Three separate revenue streams, each walled off from the others, each used to argue for the next. The money you already paid never counts; only the next ask does. It is, in effect, a machine for manufacturing shortfalls — and Burbank homeowners are the fuel.
The largest alternative has been left off the tax bill
Use fewer buildings better — and make idle public space earn money.
BUSD’s own planning materials forecast a 12% to 20% enrollment decline from 2023 to 2033. A smaller student body should trigger a public review of how much campus space the district still needs. It is not responsible to preserve every operating obligation automatically, leave rooms and grounds underused, and then present taxpayers with another bond or parcel tax.
This does not mean closing a school by slogan. It means doing the work first: measure capacity, utilization, cost, travel, program needs and neighborhood effects campus by campus. If the evidence supports consolidation, co-location, boundary changes or closing an underused wing, the savings should be calculated and acted upon before residents are billed again.
We know BUSD lost resident students. We still do not know where all of them went — or why.
The district’s September 2025 report says enrollment fell by 1,382 students from 2018–19 to 2025–26. Its more detailed November presentation shows that the most recent one-year decline was overwhelmingly among Burbank residents, not outside permit students.
BUSD attributes the wider decline to relocation, employment changes, housing and living costs, and students moving to online education. It also reports releasing 100 resident students to other public districts, mostly for FLAG programs or employment permits. But that is not a complete customer-loss analysis. The presentation does not disclose a comparable count of resident children who chose private school, charter school, homeschool or other alternatives, nor does it publish a parent exit survey explaining why.
What Burbank families and taxpayers are saying
95 comments that bear directly on the case against another tax.
These are selected comments from 17 public Burbank discussions. Every item must support at least one of three points: use existing money better; fix governance, waste or oversight before asking for more; or right-size staffing and facilities as enrollment falls. Comments that instead argue only for greater spending are excluded. These are public allegations and experiences, not findings of fact, a scientific survey or a count of unique households. Select a quotation to inspect the complete original post or comment. Source opens the live discussion when it still exists.
Showing 15 of 95 relevant public comments
-
1.
Instead of whining about the measures that failed, demand for better appropriation of existing funds. It’s always the easier route to just ask for more money.
-
2.
All goes to administrative positions as opposed to positions that directly help students
-
3.
Administrators make too damn much....teachers? I dunno...70-120k? Seems about right to me....MOST Software Engineers in LA County are in that range (my industry) so can't be too bad overall.
-
4.
It always is. His contract is still ongoing and so he gets paid.
-
5.
what will it take and how can us concerned citizens help resolve this crisis? Vote for new BUSD board members who won't give pay raise to people like Matt Hill.
-
6.
Have we paid off the Mike Hill debacle yet? There’s some money down the toilet. Lost teacher, admin and facility jobs right there. That’s where Burbank started its downhill slide.
-
7.
You’re thinking the money they have now is being spent properly?
-
8.
They also supposedly save for deferred maintenance- it's never a good idea to spend all your cash- gotta leave some reserves.
-
9.
When people complain about residents that oppose tax increases that are necessary to fund important things, just remember this is a shining example of why.
-
10.
Show up to a board meeting and make a public comment before they waste the money
-
11.
External search firms are such a racket. Honestly, if you’re looking to make absurd cash for doing hardly any work, get into that business
-
12.
the board handled it so poorly they’ll pay out the full settlement (and maybe more). Plenty of grounds to terminate but they didn’t follow the rules.
-
13.
Measure ABC passed by 63% and the voters just gave them $400 mil to improve facilities. Per the article, there are fewer students every year. And now they're talking about a parcel tax?!
-
14.
Didn't Measure I fail because it is tied to property tax? I think it's safe to assume given how high property taxes are here already, that not many homeowners could safely afford to pay more property tax.
-
15.
You are correct, it was a property tax. 10 cents a square foot. So a 2000 SqFt house would have an extra $200 of property taxes.
-
16.
Parcel Tax is the official term. The business community didn't want it.
-
17.
There have been funds/programs in the past that we’re earmarked for the schools, then allocated to other areas.
-
18.
During his time at BUSD his salary went from over $100,000. to almost $400,000.
-
19.
He was forced out by the board in the very same closed session meeting that he and Andy Cantwell fessed up to the $11 million accounting error -- or a day after, if memory serves.
-
20.
They didn't have to pay him anything. He resigned voluntarily and therefore was not entitled to his health benefits.
-
21.
However, BUSD's administration is hostile towards any and all dissent - even when it is popular opinion.
-
22.
They keep quitting because they have a do nothing superintendent, Matt Hill, who is in over his head.
-
23.
This is so sad. It’s 100% on Tabet, but sounds like Paramo just didn’t put any oversight on it
-
24.
No, he's not working at all. He's been relieved, but they eventually have to buy out his contract. If they don't, it means he did something in violation of it, and that we can find out.
-
25.
This entire issue is an issue with the BUSD being a mess due to its incompetent leadership, not housing issues.
-
26.
Let’s just say after dealing with several people recently in BUSD who work right under Macias this does not surprise me. They only seem to be driven by protecting their own.
-
27.
Can we please get a Superintendent who has actual experience in a classroom? Hill’s time at LAUSD was just fraught with examples of mismanagement. He never should have been hired.
-
28.
It's been corrupt for a long time. It's just finally being exposed. Keep the pressure on the board. Hold them accountable.
-
29.
You can go to a board meeting and ask them during public comment why they are not being transparent with the public about decisions like this.
-
30.
The issue is that he resigned as superintendent after some shady dealings and has petitioned to change that resignation to retirement.
-
31.
They didn’t fess up, they tried to blame the previous CBO.
-
32.
Also - so many good people have left under his watch. Just bleeding administrators over the past few years. There’s a saying: people don’t leave bad jobs, they leave bad managers.
-
33.
The last school board election, there was a forum question, “What is the job of the board?” If I recall correctly, only one person mentioned evaluating, hiring and firing the Superintendent.
-
34.
We know it wasn’t for banning books. But still collecting that paycheck.
-
35.
Looking like major "accounting errors" ... this was deep linked in the Meeting Highlights that went out yesterday…
-
36.
Well the Board was the one who reversed his resignation into a retirement so they can change their minds again and put it back to the original resignation and not have to pay for his health insurance.
-
37.
This has to be some kind of record. 10 principals in two years? Yikes
-
38.
I cannot believe this guy was ever hired in the first place. His tenure at LAUSD was such a disaster I never heard anyone from the outset happy by him coming to BUSD.
-
39.
Sad. I don’t know how any board member can defend their tenure over the last 4 years.
-
40.
Ive seen people try to make cases and those up there look completely disinterested
-
41.
I work with school districts across the state and BUSD is the smallest district in my book of business. The way they run that district is baffling.
-
42.
I think the real problem is the board: I have very little confidence in their ability to recruit and select the right candidate; this is a lot of the same people who renewed Matt Hill’s contract, selected John…
-
43.
Every single board member must be replaced starting with Weisberg - the bully on the pulpit.
-
44.
There has to be consequences for his actions. I don't think some one who cut some shady backroom deals and resigned in disgrace should have his status changed to "retired" and get free health care from the…
-
45.
Wouldn't all the members of the Board be encouraged to resign too? I mean, shouldn't there be a process to vet out for contracts if folks should recuse on votes. I mean, it's basic business practice 101.
-
46.
Is it possible for this decision to be reversed at the board level? Can they vote to take away his retirement benefits? Or does there need to be some kind of lawsuit or criminal inquiry to make any changes.
-
47.
Signed last time this was posted. She’s still on the board ? WTF!
-
48.
The top is the board. They are the ones who need to be replaced
-
49.
Someone should look into previous superintendents. There’s a lot to see.
-
50.
Your School Board is Lying to You Again
-
51.
That’s the reason NOT to permanently appoint him! I don’t want someone with lots of internal support from a staff that has many employees who are incompetent, dishonest, or both.
-
52.
He must have had a timed contract that they are buying out. I suspect that's what's going on here. About 1/2 of the supers we've had in Burbank the last 40 years left in this exact same way.
-
53.
Burbank school district has been going downhill since Covid. Their main issue is at the top. History of mismanaging money w/Superintendents ect..
-
54.
yup, lesson learned, BUSD is a shamble, they don't follow up on phone, and only email works to specific individuals. They are so corrupted that they can't put anything in writing.
-
55.
My kid goes to Miller and all I can recommend is making sure you email and have everything in writing and CC the Burbank unified school district and make sure everyone is put on notice what you’re requests and…
-
56.
It has to be something more if 8 principles resigned. That’s a big number for a relatively small district
-
57.
I’m conflicted. He seems competent but “old” Burbank is so awful. People retire from their BUSD jobs and their kids take their place!! Alot of the principals went to high school together.
-
58.
as someone ignorant of the subject. what actions can we take to keep them accountable?
-
59.
I feel the best thing to do is to make more people aware of the situation. Protesting really helps get the message out.
-
60.
Why are school boards always filled with so much fucking drama and scandal?
-
61.
BUSD is ruled by incompetence. We had to pull our kids - and my god, how their straight 4s in BUSD elementary turned out to be a charade once in Private School. Ugh… BUSD were wasted years.
-
62.
We moved to Burbank 21 years ago strictly for the public school system- they have gone drastically down hill-I have to say the grade schools are the best- middle schools not so much and Burroughs high school a…
-
63.
They lost my kids to private school. A lot of their classmates live in Burbank.
-
64.
I've been wondering whether to move to Burbank for my son to go to high school at Burroughs. Welp. That's gonna be a no, at this point.
-
65.
If your friend can find a better school they should send them there.
-
66.
You can’t fix a problem if you can’t admit you have a problem. There’s been a growing and thriving community of families here in Burbank who are finding greater success and support for their kids via…
-
67.
Private schools arn’t stealing kids. They’re an alternative that families are turning to … and paying tuition for… instead of free public schools.
-
68.
Why have BUSD's Academic Progress ratings on GreatSchools fallen off so badly?
-
69.
The thing is birth rates have declined rapidly the last 15 years across income levels. We are bound to have to cut some stuff. Better than Pasadena where they had to lay off a dozen teachers
-
70.
When they do go up for sale they usually sell pretty quickly yes, I just don’t see a whole lot going for sale in general though.
-
71.
Public school funding is directly correlated with school enrollment and attendance. Less kids attending mean less funding for the school.
-
72.
It's natural for neighborhoods to grow old; people retire and still want to live in their homes. My childhood neighborhood a number of schools closed because everyone living around it were retirees.
-
73.
if a street has a ton of kids in 2010, by the time 2020 rolls around most of those kids will be either in high school or getting ready to leave for college, and at that point if the parents don’t leave to make…
-
74.
Politics, taxation, declining employment opportunities have nothing to do with it, huh?
-
75.
As an animator living in Burbank, with a family, I have no reason to be here any longer. There is no animation. No animation, no families.
-
76.
If you had to pick one cause, chalk it up to birth rates. When you look at the curve, enrollment declines are most pronounced at the kindergarten level and go up from there.
-
77.
Without straying into politics I assume that at least a significant factor in this is private schooling, home schooling, etc. Also, of course, less kids.
-
78.
Yes, school enrollment is declining everywhere simply because families are choosing either to not have children or are only having 1 or 2 at the most.
-
79.
When we moved in there were kids almost every other house in our street and all the surrounding ones. Now not one house on our street has school age kids
-
80.
The real issue is just less families having kids and less of them living in the city limits.
-
81.
Same in Pasadena, Glendale, most of LA. Many families also have moved to Palmdale, Lancaster and parents commute for work. I don’t think private schools play a role.
-
82.
Can you afford a 1930s 2 bedroom 1 bath for 1.2 million here? With the mortgage , insurance, and property tax? Honest question
-
83.
Burbank housing/rent has become unaffordable with new projects being obnoxiously expensive. Burbank went from family friendly to an investment playground for wealthy investors.
-
84.
Maybe if our rent wasn’t jumping 8.9% every year for no reason we’d all stick around
-
85.
Exactly this. Yes new apartments are being built, but $2500 for a studio isn’t the solution.
-
86.
No homes, no families, no students.
-
87.
Tbh it’s not just that private school is an option, it’s that people moving to Burbank who can afford these houses are often busy professionals who don’t want kids. At least that’s what I’ve been noticing
-
88.
families aren’t moving into the area because no one can afford to move into the area and live here.
-
89.
I couldn’t afford to buy the home I’m in now if I were wanting to move here. The entire city is having a real estate crisis. Everyone is leaving.
-
90.
This is not some thing that only Burbank is experiencing. It’s the same in Pasadena, Glendale, and other parts of LA too.
-
91.
It’s not private schools. It’s 2020 flight and the economy and the entertainment industry. This is a trend throughout the region.
-
92.
You mean the low income “micro apartments” that are 350 square feet? Yes, I’m sure lots of families will go for that. I don’t mean to point my sarcasm at you, it’s meant for the city.
-
93.
Almost all multiunit housing being built in CA is studio, 1 or 2 bedroom.
-
94.
The demographers BUSD hired in 2023/24 took all approved/pending projects into account when creating their projections -- Starts at pg 403 Unfortunately, as noted below, it's a lot of studio/one bedroom…
-
95.
I would move into Burbank in a heartbeat (see my other comment about living in NoHo) if it didn't mean I was automatically increasing our mortgage payment by almost half.




















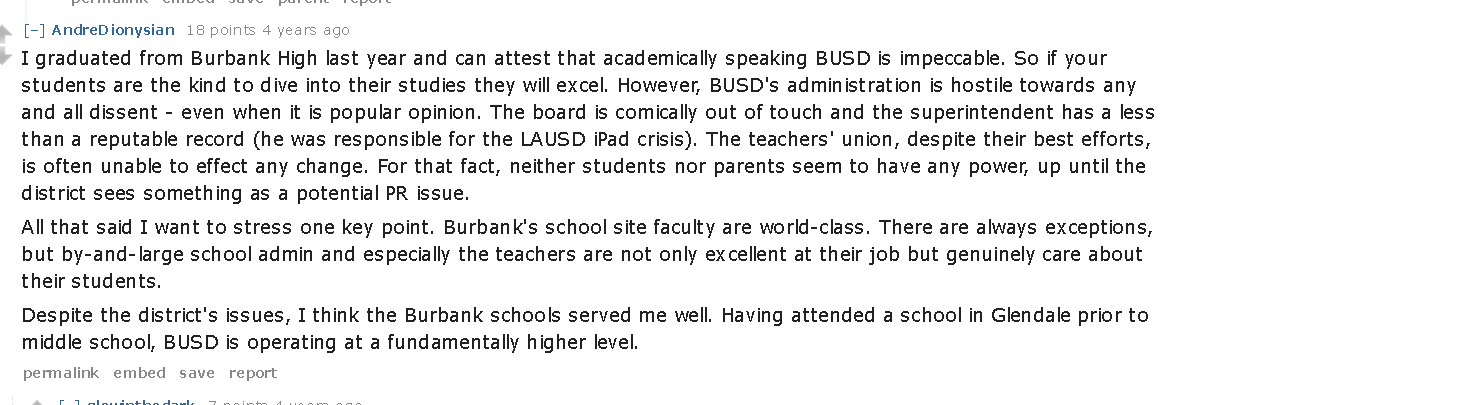
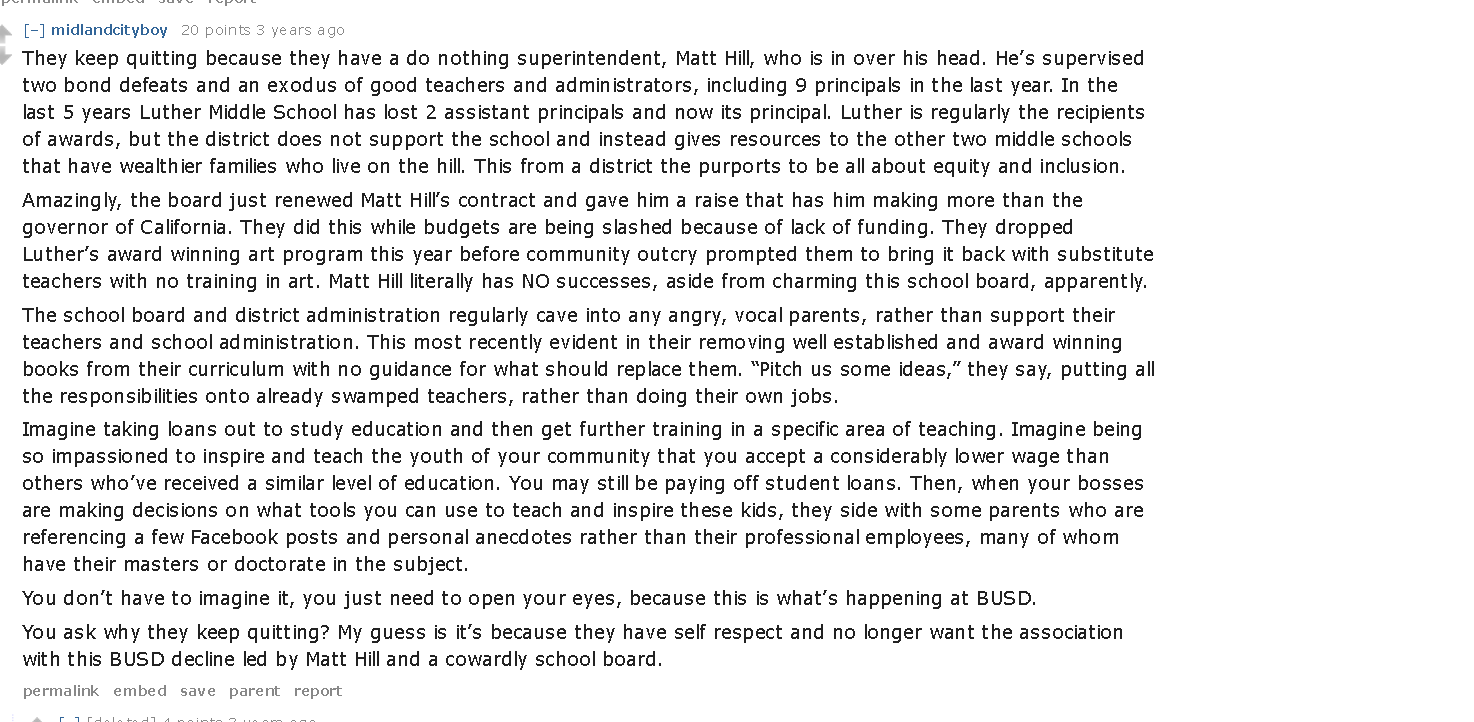



























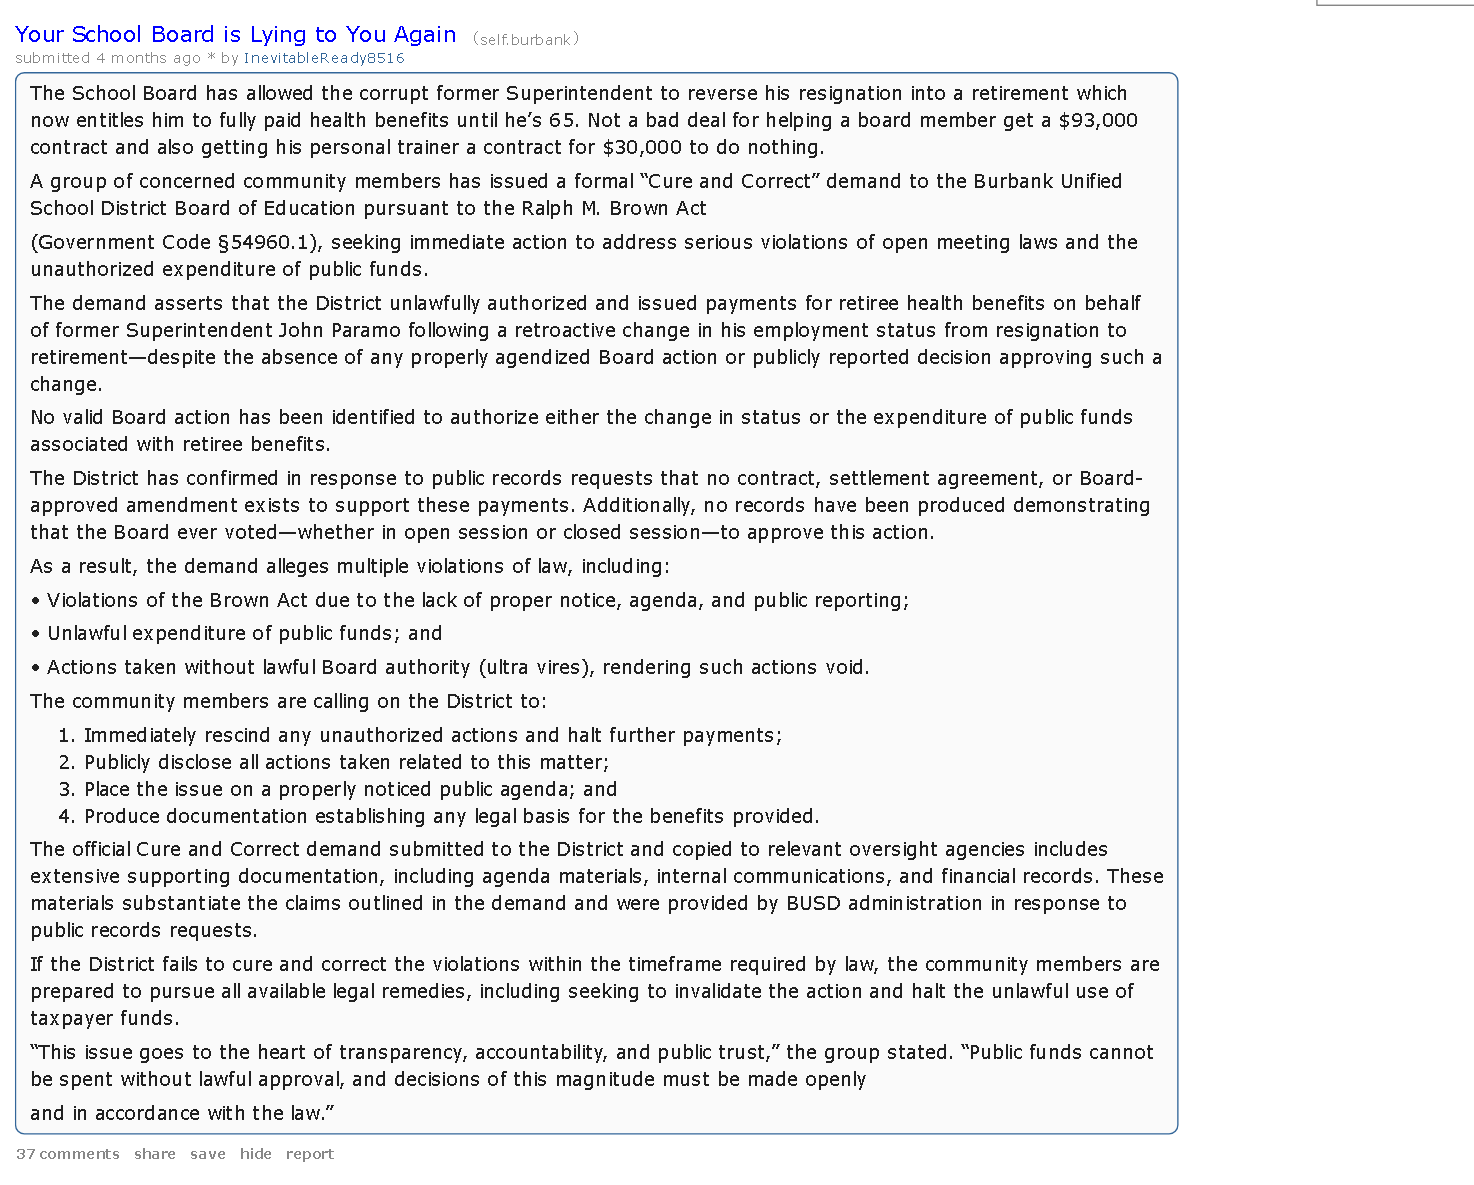















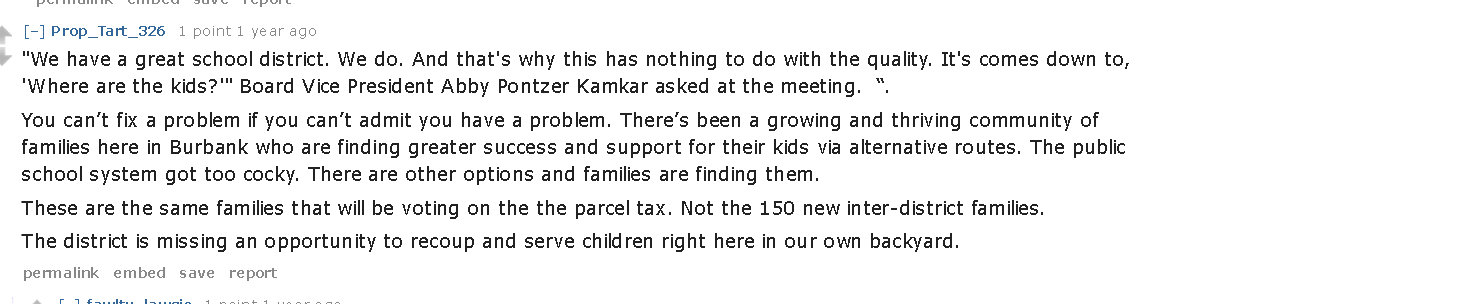



























What this index establishes: residents have repeatedly questioned stewardship of existing money, district governance and a cost structure that has not kept pace with enrollment. It does not establish that every allegation is accurate or representative. The captures preserve each complete public comment so readers can check every quotation in context; records, audits and a confidential resident-family exit survey are still needed.
Outside permits can help cash flow today — and still become a long-term trap.
The students are not the problem. The policy incentives are. BUSD has actively advertised permits to people working in Burbank as little as ten hours per week. The district’s permit enrollment is now large enough to preserve classes, staffing and buildings that resident enrollment alone may no longer support.
- It can hide the resident warning signal. Replacing a departing resident student with an outside student restores a seat count, but it does not restore the confidence of the family that left.
- It can postpone consolidation. Imported headcount may keep an oversized campus footprint looking occupied even while the resident base shrinks, delaying the operating savings taxpayers deserve.
- It can create a sudden fiscal cliff. Outside permits fell from 1,375 in 2022–23 to 1,276 in 2025–26. Staffing and facilities built around discretionary enrollment become liabilities if that demand keeps falling.
- Gross attendance funding is not net profit. The district should subtract instruction, staffing, special services, administration and facility wear attributable to permit enrollment before calling it a financial benefit.
- Burbank property owners finance the local facilities. State attendance dollars may follow a permit student, but Burbank property owners repay the district’s local bond levies. Residents deserve proof that their own children receive first priority by campus and program.
Right-size the footprint
Publish enrollment, practical capacity, occupied hours and annual operating cost for every campus. Compare consolidation, co-location and boundary options without disrupting special education, core programs or student safety.
Cut the obligations that empty space creates
Every unnecessary building or wing carries utilities, custodial work, security, administration, insurance, maintenance and future replacement costs. Show the public what each unused square foot costs before preserving it by default.
Hire people who know how to sell space
Use a qualified location manager for filming and a commercial leasing or public-asset specialist for unused space, paid against verified net new revenue. Build a professional location catalog, live availability calendar, one-stop booking desk and market-tested price list.
Put the net revenue back into the buildings
Instruction comes first. Require insurance, deposits, full cost recovery, background and safety rules, no interference with students, and transparent contracts. Deposit the net return into a published maintenance reserve instead of letting it disappear into general overhead.
BUSD already accepts facility-use requests, charges a processing fee and directs filming inquiries to FilmLA. That is a mechanism, but it is a passive one. The district’s public page does not present a searchable inventory, live calendar, annual utilization report, gross and net rental results, market-rate study or revenue target. The public should not have to assume that someone is maximizing these assets; the district should prove it.
Examples are from BUSD’s published for-profit/fair-rental rate schedule adopted in 2021. They demonstrate that rentable assets exist; they do not prove the rates are still competitive or that enough hours are being sold. That is why the rates and results should be reviewed publicly every year.
Renters pay the property-tax bill too — here is the honest number
A renter does not receive the county tax bill, but the rental property does. The property’s rent revenue must support that bill along with maintenance, insurance and every other building expense. The careful question is not whether a housing provider typed a tax surcharge into your lease. The question is how large the property-tax expense is compared with the rent the building collects.
There is no single citywide percentage. Under Proposition 13, two identical apartment buildings can have very different assessed values because one changed ownership recently and the other did not. Rent is also set by the market, so no honest analysis can say every additional tax dollar raises rent by exactly one dollar. What we can show is how much of the property-tax bill is paid from the building’s rental income.
$3,208 is a new-construction model — not typical Burbank rent.
The city model used a 2016–18 market survey plus a new-construction premium and a weighted mix of one-, two- and three-bedroom units. That is useful for testing one hypothetical project, but it should never have been presented without current and real-world benchmarks.
Actual advertised examples below the model: these were visible in the live Burbank search on August 9, 2026. Listings change quickly; they are examples, not a promise of availability or quality.
The city model is about 46% above the Census median and 30% above the current advertised median. Those are not identical measures—paid gross rent, advertised rent and a hypothetical new-building mix differ—but the comparison makes the distinction visible.
Burbank’s own apartment model
If your rent is about $3,200 a month, roughly $450 of it pays the building’s property taxes.
That is about $5,400 a year — roughly 14¢ of every rent dollar. That is absurd, and it is only the visible property tax.
The $450 figure comes from a City financial analysis of a 248-unit apartment project. Your building’s exact number may differ because California property tax depends on the property’s assessed value.
About $450 of a $3,200 rent check goes to property taxes.
Red: the building’s property-tax expense. Gray: everything else, including financing, operations, vacancies, repairs, insurance, reserves and the owner’s return.
And that is just property tax. Your rent also has to cover sales tax on repair materials and equipment; permit, inspection and construction fees; employer payroll taxes and required contributions for maintenance workers; gasoline and diesel taxes paid to bring workers and supplies to the property; taxes embedded in insurance and utilities; and the income or business taxes paid by contractors, suppliers and the housing provider. Those costs are not added to the red slice because they are buried throughout the building’s other expenses — but tenants still help pay them through rent.
The tax upon tax upon tax hidden inside a rent check
One rent dollar can support several taxable transactions before anyone calls the remainder profit:
- The building pays property tax first: the 1% base levy, school-bond debt and any other voter-approved or parcel-specific charges on that property.
- Construction starts with government charges: the same city feasibility model budgeted public permits and fees at roughly $20,000 per unit, before separately grouping taxes, insurance, legal and accounting costs.
- A repair buys taxed materials: taxable supplies purchased in Burbank generally face a 10.5% sales-and-use-tax rate. The contractor also pays tax on business income.
- Repair labor carries payroll layers: covered wages include employer Social Security and Medicare contributions, California unemployment insurance and Employment Training Tax; the worker also has employee payroll and income-tax withholding.
- The truck arriving with the repair carries fuel taxes: California’s state gasoline excise tax is 63.4¢ per gallon for July 2026–June 2027, on top of the 18.4¢ federal excise tax, applicable sales tax and other fuel-related fees.
- Insurance contains another tax layer: California taxes insurers on gross premiums. The cost is part of the market price of property, liability, vehicle and workers’-compensation coverage even when it is not printed as a tenant surcharge.
- Whatever remains can be taxed again: the contractor, suppliers and housing provider may owe federal and state income or entity taxes on taxable profit after allowable expenses.
Why these percentages are not simply added: they apply to different bases at different stages, and some are paid by employers, workers, suppliers, insurers or owners rather than appearing as a separate line on the lease. Adding every statutory rate would double-count the same dollar and exaggerate the result. A complete building-level answer requires its property-tax bill, operating ledger, payroll, invoices, insurance, utilities, financing and tax returns.
The tax bill hidden inside the rent
Burbank’s own apartment model budgets $450 of the average modeled monthly rent—$5,400 a year—for total property tax, including the base levy and local voter-approved charges.
Enter your rent. See the city-model property-tax estimate.
Enter the monthly rent you actually pay. The calculator applies the property-tax ratio used in the City of Burbank’s apartment feasibility model, including local charges.
How it works: Burbank’s model assigns $450 in monthly property tax against $3,208 in monthly rent, a 14.03% ratio. This calculator applies that same total-property-tax ratio to your rent. It is an estimate, not your housing provider’s actual bill; parcel-specific assessments and other embedded taxes may add more.
The citywide scale
A tiny-looking rate becomes millions across Burbank’s commercial tax base.
BUSD’s official 2024–25 taxpayer table supplies the assessed values. Applying the current 0.052359% BUSD bond levy shows the approximate annual scale:
That is the larger story. A tenant’s calculation estimates one unit’s share. The bond levy also reaches the commercial and industrial properties that define Burbank’s economy. Their taxes are business overhead supported through some combination of prices, rents, earnings and investment returns.
Important limits: these figures are mathematical levy equivalents based on the listed assessed values, not representations of exact cash received after every adjustment. The district table lists each legal taxpayer name separately and warns that related property may be held under other names. It lists Walt Disney Productions but does not identify ABC as a separate top-twenty taxpayer, so no unsupported ABC figure is assigned here.
The Robin Hood squeeze follows you to the checkout counter
Burbank pays twice. First, our existing local property-tax revenue is counted inside California’s school-funding formula, reducing the state aid required to reach Burbank’s target. Then Burbank voters are told to approve local bonds and parcel taxes to fill needs the regular budget did not cover.
BUSD’s adopted budget reports $71.7 million in local property taxes and other local revenue inside its LCFF sources. Those local dollars are credited before the state supplies the formula balance.
A school bond adds a separate property levy, while a parcel tax would add another local bill. Bond proceeds stay in Burbank; the injustice argued here is that the statewide formula helps create pressure for this second charge.
That second bill does not stop at the property line. It enters the cost of doing business — and business costs reach prices, rents, jobs, investment and paychecks.
- The district’s debt creates a levy. The county applies the BUSD rate to taxable secured property throughout the district.
- The property owner pays the bill. A studio campus, store, mall, office or apartment building carries the added property cost.
- The business must absorb that cost. Owners and tenants recover total operating costs through some mix of prices, fees, commercial rent, reduced margins, lower investment or compensation pressure.
- The public feels the result indirectly. The added cost can reach a subscription, production budget, merchandise purchase, store receipt, lease or paycheck without appearing as a line labeled “school bond.”
The tax collector does not print “BUSD bond” on your grocery receipt, gasoline pump, streaming bill or restaurant check. But every tax dollar is ultimately absorbed by somebody. Customers, tenants, workers, investors and business owners divide the burden according to leases, competition and pricing power. The exact split changes; the burden does not disappear. Another bond adds a cost that must be absorbed somewhere.
Now remember what renters already paid. Renters pay state income tax and state sales and use tax just like homeowners. The building’s rental income also pays its property-tax bill, including the BUSD bond levy. In the district’s adopted budget, $71.7 million in local property taxes and other local revenue is credited inside LCFF before state formula aid is calculated. Any new parcel tax or bond would be another layer on top. That is why every new ask deserves a complete, itemized accounting of what renters and homeowners already carry.
A Burbank renter describes the pressure
“Maybe if our rent wasn’t jumping 8.9% every year for no reason we’d all stick around.”
This is one resident’s public comment, not proof that taxes caused a particular rent increase. It belongs here because it shows why policymakers must explain every additional housing cost and why the district should measure what is driving resident-family departures.
You may not own the building, but you are not powerless — because renters vote. Twice, Burbank voters rejected a school parcel tax. Twice, they approved a bond whose debt service appears on property-tax bills, including the bills for rental buildings. The next local tax proposal is already being discussed for 2026. Your vote can stop another layer before it becomes another recurring property expense.
Every levy on property is also a cost of housing
A bond is not only a line on a tax bill. It is a cost of owning the building, and in a rental market it is a cost of operating one. That cost does not stop at the property line — it shows up in rents, and it shows up in what gets built.
Los Angeles is the case study nobody has to imagine. The city permitted apartment buildings of five or more units at this rate:
| Year | Buildings permitted | Units |
|---|---|---|
| 2023 | 157 | 7,609 |
| 2024 | 122 | 5,156 |
| 2025 (through 31 August) | 90 | 3,704 |
Measure ULA, the Los Angeles transfer tax effective April 2023, is the closest thing to a controlled experiment. The UCLA Lewis Center estimates it reduced multifamily production by at least 1,910 units a year — an 18% decline among projects of 20 or more units, measured against the 2020–2022 average. Raise the cost of holding or transferring the asset, and less of it gets built. That is not ideology; it is the permit record.
So the question in front of Burbank is not only whether the schools need money. It is whether stacking another permanent charge onto property — in a county already permitting less housing every year — is the tool that fixes it.
Call it what it is: the double-tax squeeze
Burbank taxpayers already contribute through state and local taxes. Within LCFF, local property-tax revenue is credited toward the district’s entitlement before state formula aid supplies the balance. Then local officials may ask the same community to approve a separate bond or parcel tax for needs the regular budget does not cover. That is the documented double-bill problem: the first payment does not prevent a second local charge.
Understand the local choice plainly: proposing another tax is easier than publishing a complete lifecycle plan, right-sizing facilities as enrollment falls, maximizing outside-use revenue, itemizing management costs and building a statewide coalition for LCFF reform. That order of operations has to change.
So what do we do about it? Here is the plan.
This is fixable. There are exactly three levers, and every one of them runs through people you can reach.
Sacramento — reform LCFF without weakening Proposition 98
Proposition 98 protects the statewide school-funding minimum. The Legislature can reform LCFF without removing that floor. Burbank should demand a smoother concentration formula, transparent district-to-district comparisons and serious consideration of regional operating costs so middle-need districts are not pushed toward repeated local tax proposals.
The Board of Education — fight for our money, don’t tax us again
The Board should fight upstream and prove local stewardship before asking for another dollar. That means a formal LCFF-reform resolution, a coalition with similarly situated districts, an annual formula bridge, a lifecycle facilities plan, a complete debt schedule, a campus-utilization audit and a public alternatives analysis before any new tax proposal.
The ballot box — your vote is the veto
No local school tax passes without you. A parcel tax needs a two-thirds yes vote; a bond needs 55%. That is real power, and it is yours.
We want every California child to have a good school. We also reject a system that leaves middle-need districts under pressure and treats repeated local tax measures as the routine answer. We create our community. We fund our community. And we expect Sacramento and local management to use that money transparently, responsibly and effectively.
Additional fact-check sources for the bond-budgeting and payroll sections: California Constitution Article XIII A, section 1(b)(3), and Education Code section 15278 establish the 55% voter-approval path, the facilities-only restriction, the prohibition on teacher or administrator salaries and other operating expenses, and project-level accountability for qualifying school bonds. The California Department of Education’s 2025–26 budget standards require districts to confirm that maintenance funding is adequate to preserve facilities for their normal life; CDE’s long-range facilities guidance calls for continuous planning and financing, including long-range maintenance budget items. Burbank Unified’s 2025–26 Adopted Budget shows Deferred Maintenance Fund 14 with $0 budgeted revenue, $0 budgeted spending and an $18,859.75 ending balance; Special Reserve Fund 40 for Capital Outlay Projects with $3 million budgeted spending, no budgeted revenue and a $12,935,500.53 ending balance. These fund balances do not by themselves establish whether all maintenance spending elsewhere in the budget was adequate; they establish the reserve figures voters should compare with the district’s long-range facilities plan and proposed debt. Payroll figures reproduce the attached fiscal-year 2025–26 LACOE payroll-reporting workbook. California Department of Education, California School Accounting Manual, Procedure 330, defines employee-benefit objects 3000–3999 to include employer retirement-plan contributions, health and welfare, OASDI/Medicare or alternative retirement, unemployment insurance, workers’ compensation, OPEB and other benefits.
Facilities, enrollment and outside-use sources: BUSD’s Facilities Master Plan presents enrollment scenarios declining 12% to 20% from 2023 to 2033. The district’s Use of Facilities page describes its request, approval and invoicing process and directs filming to FilmLA; the linked Facility Use Rate Schedule is effective August 1, 2021. California Education Code section 38134 defines direct costs and fair rental value for qualifying outside uses and directs certain maintenance-related receipts to a special fund. Education Code sections 17515–17526 authorize and regulate joint-occupancy agreements. The recommended consolidation and professional-marketing program is this article’s policy proposal, not a claim that state law requires it.
Enrollment-cause, permit and parent-trust sources: BUSD’s September 2025 enrollment update reports a 1,382-student decline since 2018–19 and approximately 220 new outside permits annually. Its November 2025 enrollment presentation reports 12,548 BUSD-resident students, 1,276 interdistrict-permit students, a 446-student total annual decline and 100 releases to other districts. BUSD’s 2026 permit notice solicits applications from families with a parent or guardian working in Burbank at least ten hours per week. The district’s 2019 Board minutes described permit screening for satisfactory grades, attendance and discipline and estimated permit-generated revenue at approximately $13 million at that time; the article therefore makes no claim that outside students are academically or behaviorally inferior. BUSD’s equity-policy page and 2025–26 DEI goals report establish the current programming; the Center for American Liberty commentary links the underlying gender-support and DEI documents and presents a critical interpretation. The quoted social-media comments are anecdotal and are not used as statistical evidence.
Additional fact-check sources for the state overhead section: California Department of Finance, 2025–26 Enacted Budget — Department of Education: $509.504 million in CDE state operations, 2,683 positions, $358.603 million in personal services, $146.508 million in operating expenses and equipment, $4.393 million in special items, $112.155 billion in local assistance, and $5.437 million / 24.1 positions for the State Board of Education. Governance and compliance findings are summarized from TK–12 Education Governance in California: Past, Present, and Future (2026), including its findings on fragmented authority, overlapping responsibilities and extensive reporting requirements.
Sources: Proposition 98 minimum guarantee and the “about 40 cents for each $1” relationship — California Legislative Analyst’s Office, annual Proposition 98 spending-plan reports. The guarantee is set by three alternative tests rather than a fixed percentage, and can be suspended by a two-thirds vote of each house. Current Expense of Education per average daily attendance — California Department of Education, 2024–25, presented via LA Almanac. The Los Angeles County Assessor’s 2025 city roll lists $34,240,754,027 for Burbank; sorting all 88 incorporated-city values places Burbank ninth. The approximate $342.4 million figure is simply 1% of assessed value before allocation and is not represented as BUSD revenue. Revenue itemization — Burbank Unified School District 2025–26 Adopted Budget: $213,382,021 General Fund revenue; $170,073,136 LCFF sources, including $71,651,717 in property taxes and other local revenue and $27,095,803 from the Education Protection Account; $31,192,954 other state; $7,984,906 federal; and $4,131,026 other local. State tax sources — California Department of Finance, 2026–27 General Fund cash-flow schedule. Proposition 98 purpose and operation — Legislative Analyst’s Office: voters created a constitutional minimum guarantee, met through state General Fund and local property-tax revenue. LCFF mechanism — California Department of Education and Legislative Analyst’s Office: local property-tax revenue is credited toward the LCFF entitlement and state aid supplies the remainder. History — Serrano v. Priest (1971–1977); Proposition 13 (1978); Proposition 98 (1988); and LCFF (2013). Local tax stack — Measure S, Measures QS and I, and Measure ABC, per election materials and the Los Angeles County Registrar-Recorder.
Renter-tax sources and method: The Los Angeles County Auditor-Controller’s 2025–26 Taxpayers’ Guide lists current BUSD secured-roll debt-service rates totaling 0.052359%. BUSD’s official 2024–25 major-taxpayer table lists the secured assessed values used in the commercial-scale calculation, a $30,551,765,940 local secured roll and $5,583,051,672 held by the twenty largest listed taxpayers. The California Board of Equalization explains the 1% base levy, voter-approved bond additions and Proposition 13 assessed-value rules. The City of Burbank inclusionary-housing feasibility analysis models $5,400 annual property tax per market-rate apartment unit against $9.546 million annual apartment rent for 248 units, plus about $20,000 per unit in public permits and fees in its development-cost table. The U.S. Census Bureau reports Burbank median gross rent of $2,192 for 2020–24. A dated rental-listing source reported a $2,477 median and supplied the advertised examples; availability and prices can change. Tax-cascade rates come from the California Department of Tax and Fee Administration (Burbank sales/use tax and fuel taxes), IRS Publication 15 (Social Security and Medicare), California EDD (UI and ETT), and the Board of Equalization (gross-premiums tax). Calculations are accounting allocations; they do not assume that market rent changes dollar-for-dollar with a tax bill, and the indirect rates are deliberately not added because they apply to different tax bases and actors. Prepared by the Burbank Republican Party.